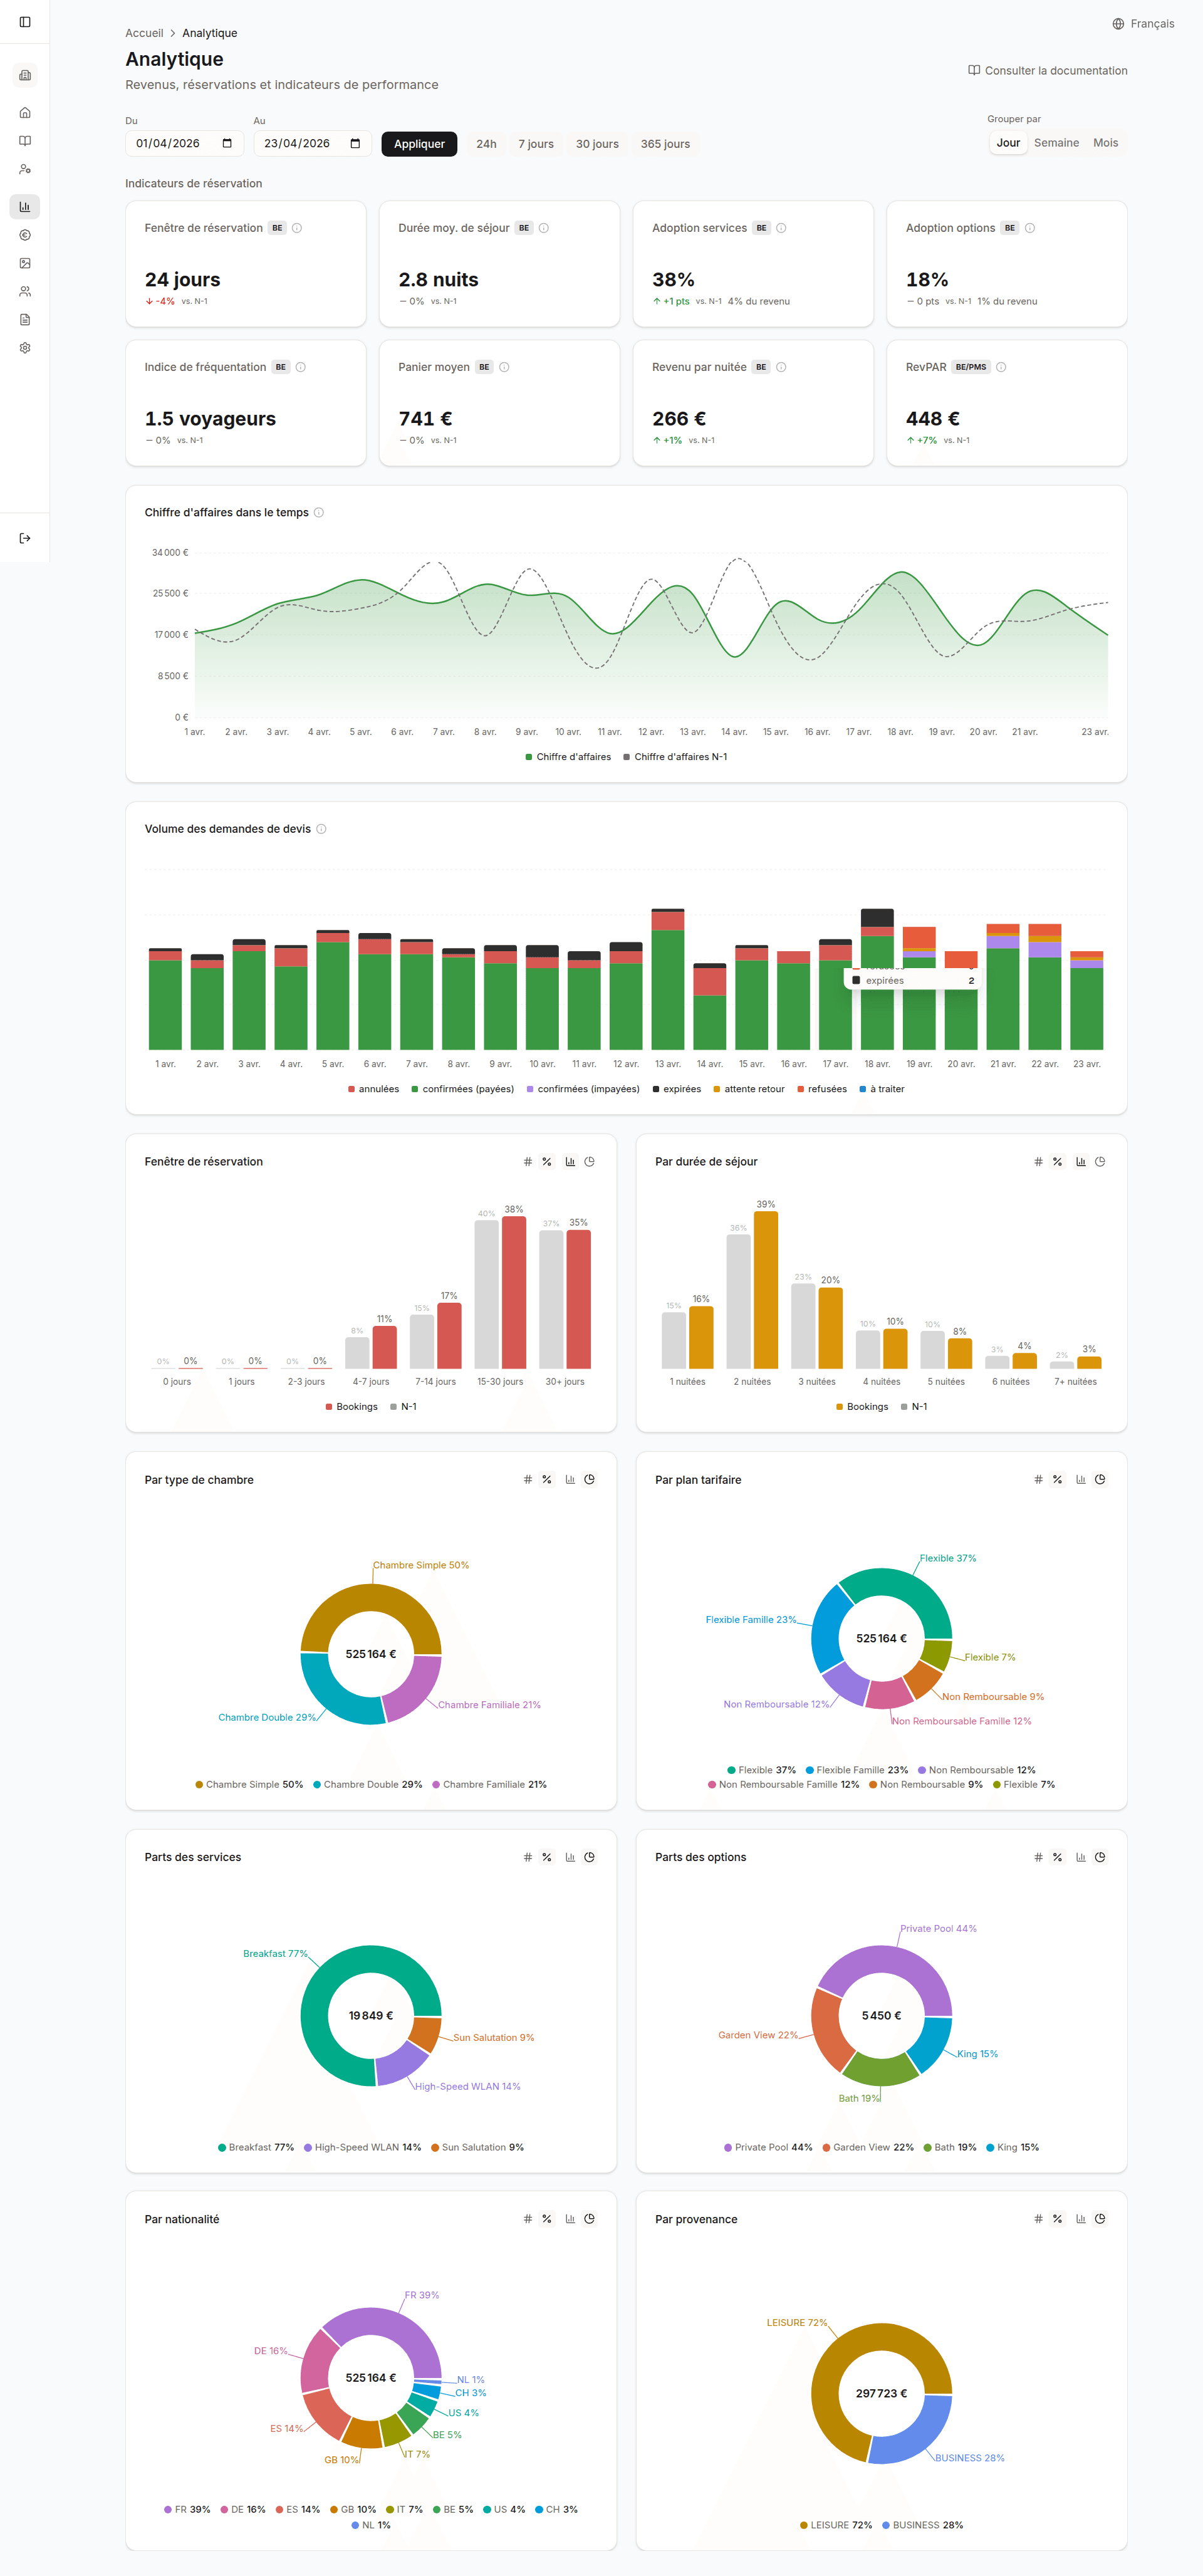
Analytics
Access: owners and managers.
Click Analytics in the sidebar.
Period selector
Choose the analysis window: 24h, 7 days, 30 days, 365 days.
The period is rolling: “30 days” = the last 30 days from today, not the calendar month. Each change recalculates every indicator and chart.
Year-over-year comparison
Each indicator shows the change against the previous period of the same length.
Example with a 30-day period selected on April 20:
- Current period: March 22 to April 20
- Previous period: February 19 to March 21 (the 30 days just before)
The previous period always ends the day before the start of the current period.
Revenue evolution chart
Curve of confirmed revenue over the period, with lost revenue overlaid.
Automatic granularity:
- Period of 90 days or less: one bar per day
- Period over 90 days: one bar per month
Volume chart
Stacked bars of the number of bookings by status over the period.
Breakdown by criterion
Break down revenue and volume by:
- Room type: revenue per category
- Rate plan: revenue per applied rate
- Country: revenue by the booker’s country of residence
- Length of stay: 1 night, 2, 3, 4, 5, 6, 7+ nights
- Booking window: 0, 1-3, 4-7, 7-14, 15-30, 30+ days before arrival
- Travel purpose: business, leisure, other
- Best-selling services: ranked by revenue
- Best-selling options: ranked by revenue
Detailed indicators
All indicators only count confirmed bookings (unless stated otherwise).
Confirmed revenue
Sum of the gross amounts (incl. tax) of all confirmed bookings over the period.
Collected
Sum of the payments actually recorded on confirmed bookings.
Lost revenue
Sum of the gross amounts of canceled + refused + expired bookings over the period. The breakdown by reason (canceled, refused, expired) is shown separately.
Average booking value
Confirmed revenue / number of confirmed bookings
Revenue per night
Confirmed revenue / total number of nights sold
Quote conversion rate
Confirmed bookings / (confirmed + canceled + refused + expired)
Only counts bookings that have reached a terminal status. Requests still in progress (to process, awaiting response) are not counted.
Occupancy rate
Nights sold via Hestia / (number of Apaleo rooms x days in the period)
The room stock comes from Apaleo. The numerator only counts the nights of confirmed bookings made through Hestia.
RevPAR (Revenue Per Available Room)
Confirmed revenue / (number of Apaleo rooms x days in the period)
Rounded to 2 decimals.
Average length of stay
Average number of nights per confirmed booking.
Average booking window
Average number of days between the request creation date and the arrival date.
Average group size
Average number of travelers (adults + children) per booking.
Service adoption rate
Percentage of confirmed bookings including at least one service.
Share of services in revenue
Service revenue / total revenue x 100
Option adoption rate
Percentage of confirmed bookings including at least one option.
Share of options in revenue
Option revenue / total revenue x 100